[[Manuals for Data Users/id|Manual untuk Pengguna Data]]
Manual untuk Pengguna Data
Pengguna iSIKHNAS terdaftar memiliki akses terhadap hampir semua atau seluruh data yang tersedia di dalam database, namun seringkali demi kesederhanaan dalam penggunaan, data tersebut ditampilkan sesuai dengan pengguna individu dengan menggunakan pengaturan Jenis Pengguna dan Area Tanggung Jawab yang ditentukan oleh koordinator lokal. Hal ini telah dibuat sedemikian rupa sehingga data yang memiliki relevansi langsung dapat tersedia segera. Data lain yang juga penting dalam memahami konteks yang lebih luas dari kabupaten/kota tertentu atau area kepentingan lain juga tersedia kapan saja untuk dilihat dan digunakan.
Ways of accessing data
The Reports menu offers an already long and growing list of reports in different formats (tables, charts etc) which display data for useful analysis and to improve your understanding of the animal health situation in your area, the coverage of your vaccination campaign, the performance of field staff or any of the .
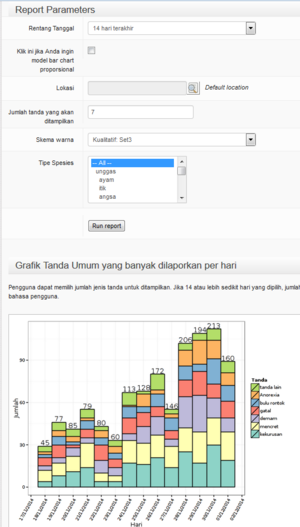
These reports can be further tailored by using the options at the top of the report page. The options available are often different for each type of report and are valuable tools which allow users to filter all the data available in the database to just that information which is most relevant and interesting. They include time period, location or geographical filters, and filters which allow users to choose species, signs, diseases, reporter types and others.
As the number of users increases and the full extent of all the tools available in iSIKHNAS are being used many more reports will be developed. Data users will notice frequent changes in the list of reports available every time they log in to the system. The database will be working very hard to display these reports quickly but some aspects which are likely to slow down the process of producing reports include the time period chosen, the number of species or other specific data types, and the geographical area. There is already a great deal of data in the database, as you can imagine, so to cut down the processing time try to choose reasonable time periods such as a week, two weeks or a month (not all available data) and choose only the information which truly interests you (not data for all of Indonesia). Your reports will be produced quickly and efficiently if you keep this in mind each time you press Run Report.


