What does it do?: Perbedaan revisi
(Marked this version for translation) |
|||
| Baris 3: | Baris 3: | ||
<!--T:2--> | <!--T:2--> | ||
| − | + | Using iSIKHNAS, we can link laboratory submission data with disease reports; maps with movement data or outbreak reports; slaughter data with production and population data; and all smoothly and automatically in easy to use formats. That is great for decision makers at every level and good for everyone who is working in the animal health sector. | |
<!--T:3--> | <!--T:3--> | ||
| − | + | The variety of reports available via the website or automatically sent by email is always expanding. Upon request, new reports can be created for regular viewing and reporting, analysis and information sharing. | |
| + | |||
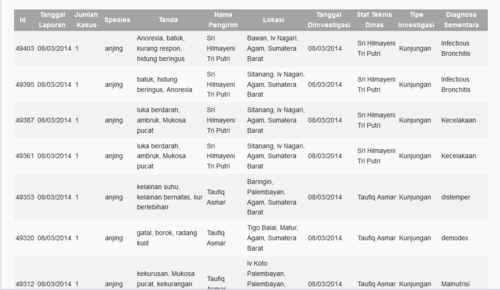
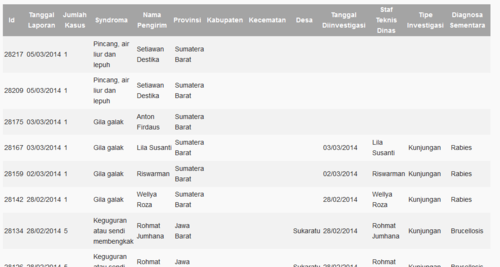
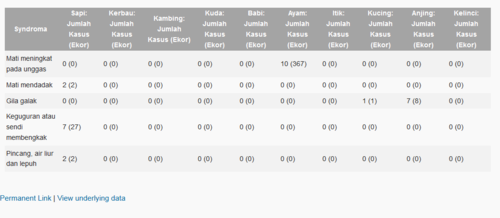
| + | Here are a very few examples of the automated disease related reports available. | ||
| + | [[Image:Disease_report1.png|500px|frameless|left]] [[Image:Priority_disease_report1.png|500px|frameless|centre]][[Image:Priority_disease_report2.png|500px|frameless|left]] | ||
| + | |||
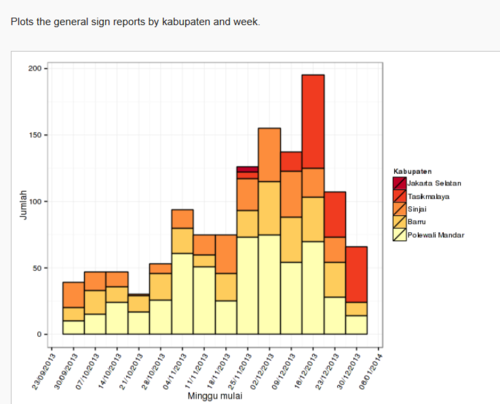
| + | Many reports are available as a graph. | ||
| + | [[Image:General_signs_report_by_kabupaten_by_week.png|500px|frameless|left]] | ||
| + | |||
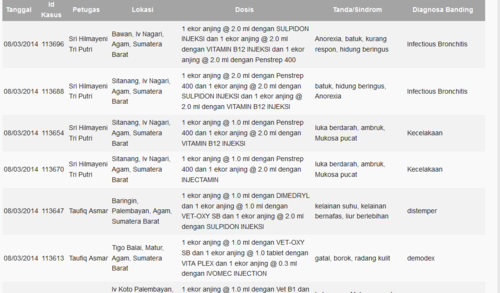
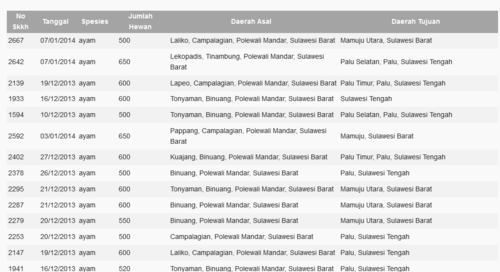
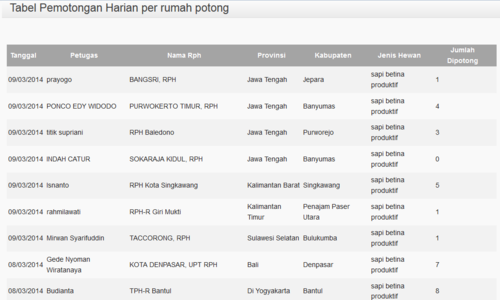
| + | Some reports relate to wider activities such as treatment, movement and slaughter, for example. | ||
| + | [[Image:Treatment_report.png|500px|frameless|left]] | ||
| + | [[Image:Movement_report1.png|500px|frameless|left]] | ||
| + | [[Image:Productive_female_slaughter.png|500px|frameless|left]] | ||
| + | |||
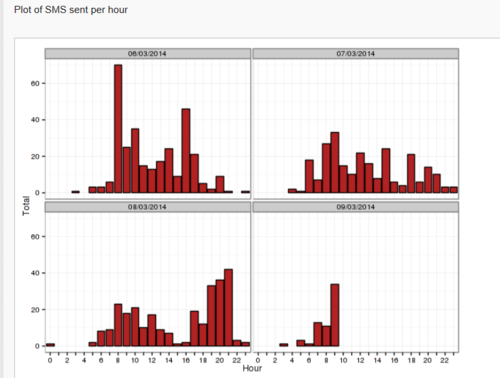
| + | Other reports relate to the system, staff or resources. | ||
| + | [[Image:SMS_sent_per_hour.png|500px|thumb|left]] | ||
| + | |||
</translate> | </translate> | ||
Revisi per 9 Maret 2014 10.05
What does it do?
Using iSIKHNAS, we can link laboratory submission data with disease reports; maps with movement data or outbreak reports; slaughter data with production and population data; and all smoothly and automatically in easy to use formats. That is great for decision makers at every level and good for everyone who is working in the animal health sector.
The variety of reports available via the website or automatically sent by email is always expanding. Upon request, new reports can be created for regular viewing and reporting, analysis and information sharing.
Here are a very few examples of the automated disease related reports available.
Many reports are available as a graph.
Some reports relate to wider activities such as treatment, movement and slaughter, for example.
Other reports relate to the system, staff or resources.

