Manuals for Data Users: Perbedaan revisi
(Marked this version for translation) |
|||
| (6 revisi antara oleh pengguna yang sama tidak ditampilkan) | |||
| Baris 1: | Baris 1: | ||
<translate> | <translate> | ||
| − | == | + | ==Manual for Data Users== <!--T:1--> |
| + | |||
| + | [[Image:Reports.svg|100px|left]] | ||
<!--T:2--> | <!--T:2--> | ||
| − | + | Registered users of iSIKHNAS have access to most or all of the data available in the database but often, for simplicity of use, the way this data is displayed is tailored to the individual user by using the User Type and Area of Responsibility settings established by the local coordinator. This has been done so that the data ''of most immediate relevance'' is available first. Other data which may be of interest in understanding the wider context outside a particular district, or area of interest is also available at any time for viewing and use. | |
| + | |||
| + | |||
| + | |||
| + | |||
| + | <!--T:3--> | ||
| + | [[File:Link.svg|50px|left]] | ||
| + | *[[Website_Data|''Go to '''Module 16: Using iSIKHNAS data''''']] | ||
| + | |||
| + | |||
| + | |||
| + | ===Ways of accessing data=== <!--T:4--> | ||
| + | |||
| + | ====Via the iSIKHNAS website using the '''Reports''' section on the left-hand menu==== <!--T:5--> | ||
| + | {| | ||
| + | |- | ||
| + | | [[File:Menu ind.png|100px|left]] || [[File:Menu reports ind.png|100px|left]] || [[File:Menu umum ind.png|100px|left]] | ||
| + | |} | ||
| + | |||
| + | <!--T:6--> | ||
| + | The '''Reports''' menu offers an already long and growing list of reports in different formats (tables, charts etc) which display data for useful analysis and to improve your understanding of the animal health situation in your area, the coverage of your vaccination campaign, the performance of field staff or any of the . | ||
| + | |||
| + | <!--T:7--> | ||
| + | [[File:Report_parameters_ind.png|300px|centre]] | ||
| + | |||
| + | <!--T:8--> | ||
| + | These reports can be further tailored by using the options at the top of the report page. The options available are often different for each type of report and are valuable tools which allow users to ''filter'' all the data available in the database to just that information which is most relevant and interesting. They include time period, location or geographical filters, and filters which allow users to choose species, signs, diseases, reporter types and others. | ||
| + | |||
| + | <!--T:9--> | ||
| + | As the number of users increases and the full extent of all the tools available in iSIKHNAS are being used many more reports will be developed. Data users will notice frequent changes in the list of reports available every time they log in to the system. The database will be working very hard to display these reports quickly but some aspects which are likely to slow down the process of producing reports include the time period chosen, the number of species or other specific data types, and the geographical area. There is already a great deal of data in the database, as you can imagine, so to cut down the processing time try to choose reasonable time periods such as a week, two weeks or a month (not ''all available data'') and choose only the information which truly interests you (not data for all of Indonesia). Your reports will be produced quickly and efficiently if you keep this in mind each time you press '''Run Report'''. | ||
| + | |||
| + | Be aware also that map-based reports can take a long time to complete, particularly if your internet connection is slow. | ||
</translate> | </translate> | ||
Revisi terkini pada 23 Maret 2015 22.19
Manual for Data Users
Registered users of iSIKHNAS have access to most or all of the data available in the database but often, for simplicity of use, the way this data is displayed is tailored to the individual user by using the User Type and Area of Responsibility settings established by the local coordinator. This has been done so that the data of most immediate relevance is available first. Other data which may be of interest in understanding the wider context outside a particular district, or area of interest is also available at any time for viewing and use.
Ways of accessing data
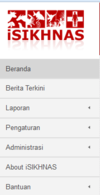
The Reports menu offers an already long and growing list of reports in different formats (tables, charts etc) which display data for useful analysis and to improve your understanding of the animal health situation in your area, the coverage of your vaccination campaign, the performance of field staff or any of the .
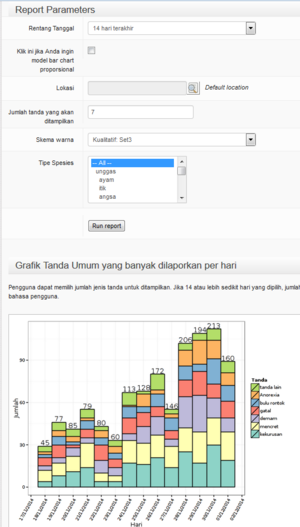
These reports can be further tailored by using the options at the top of the report page. The options available are often different for each type of report and are valuable tools which allow users to filter all the data available in the database to just that information which is most relevant and interesting. They include time period, location or geographical filters, and filters which allow users to choose species, signs, diseases, reporter types and others.
As the number of users increases and the full extent of all the tools available in iSIKHNAS are being used many more reports will be developed. Data users will notice frequent changes in the list of reports available every time they log in to the system. The database will be working very hard to display these reports quickly but some aspects which are likely to slow down the process of producing reports include the time period chosen, the number of species or other specific data types, and the geographical area. There is already a great deal of data in the database, as you can imagine, so to cut down the processing time try to choose reasonable time periods such as a week, two weeks or a month (not all available data) and choose only the information which truly interests you (not data for all of Indonesia). Your reports will be produced quickly and efficiently if you keep this in mind each time you press Run Report.
Be aware also that map-based reports can take a long time to complete, particularly if your internet connection is slow.


