
Berkas yang tak terkategori
Menampilkan sampai dengan 50 hasil dalam rentang #601 sampai #650.
Lihat (50 sebelumnya | 50 selanjutnya) (20 | 50 | 100 | 250 | 500)
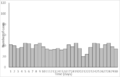 Endemic epidemic curve.svg 800 × 513; 18 KB
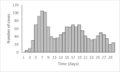 Epidemic curve.svg 806 × 483; 16 KB
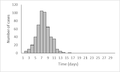
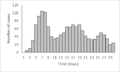 Epidemic curve 1.png 571 × 342; 9 KB
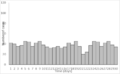
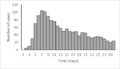 Epidemic curve 2.png 586 × 338; 9 KB
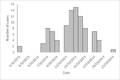
 Epidemic curve 3.png 591 × 356; 9 KB
 Epidemic curve 4.png 818 × 502; 35 KB
 Epidemic curve 5.png 662 × 439; 24 KB
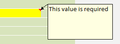 Errorhighlight.png 267 × 99; 1 KB
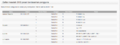 Errors by user report.png 1.120 × 418; 54 KB
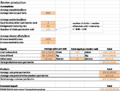 Estimating the cost of disease HPAI.png 734 × 556; 34 KB
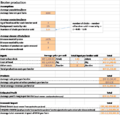 Estimating the cost of disease HPAI2.png 734 × 701; 45 KB
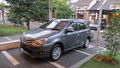 Etios valco.JPG 4.608 × 2.592; 2,9 MB
 Evaluating a spreadsheet.docx ; 26 KB
 Ewan Tasikmalaya coordinator.png 2.045 × 2.299; 2,32 MB
 Exam of mouth.png 3.456 × 2.304; 7,2 MB
 Example.jpg 1.698 × 1.038; 923 KB
 Example create training course.png 599 × 631; 35 KB
 Example group permissions.png 1.466 × 878; 121 KB
 Example group permissions 2.png 1.405 × 350; 47 KB
 Example map.svg 1.052 × 744; 457 KB
 Example of costs.png 409 × 202; 9 KB
 Example page address.svg 922 × 608; 145 KB
 Excel import.svg 892 × 747; 34 KB
 Excel logo.png 256 × 256; 77 KB
 Excelkartuternak.png 1.920 × 1.080; 165 KB
 Exercise 12 Diarrhoea by season and month.svg 739 × 543; 184 KB
 Exercise 12 Diarrhoea by season and month 2.svg 741 × 468; 68 KB
 Exercise 6 Answer table.svg 747 × 188; 37 KB
 Exportstandards.png 708 × 237; 16 KB
 F.png 220 × 214; 2 KB
 FOWL TYPHOID.pdf ; 1,14 MB
- Faostatindo.xlsx ; 41 KB
 Farmer.jpg 3.744 × 5.616; 602 KB
 Farmer ID.png 400 × 300; 221 KB
- Farms 33S.zip ; 519 KB
- Fasilitators agenda.docx ; 30 KB
 Female vet.png 1.955 × 2.202; 4,75 MB
 Figure 1 Types of variables that can be used in data analysis.svg 892 × 378; 18 KB
 Figure 2 A probability distribution function (red-line).png 800 × 419; 10 KB
 Figure 3 The Priority syndromes.png 1.696 × 1.066; 253 KB
 Figure 3 The Priority syndromes.svg 924 × 581; 338 KB
 Figure 4 Possible folder structure.png 1.616 × 916; 115 KB
 Figure 4 Possible folder structure.svg 878 × 498; 125 KB
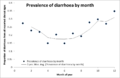 Figure 6.svg 942 × 614; 50 KB
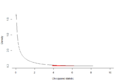 Figure 7 Chi-squared probability distribution.png 784 × 544; 7 KB
 Financial-graph-icon-psd.png 1.280 × 1.024; 497 KB
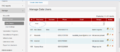 Find individual user.png 2.134 × 924; 562 KB
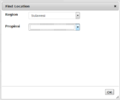 Find location.png 513 × 427; 8 KB


.png)


Lihat (50 sebelumnya | 50 selanjutnya) (20 | 50 | 100 | 250 | 500)