GIS AH Answers/id: Perbedaan revisi
(Created page with "''Kembali ke teks''") |
(Created page with "=== 50px ''Tingkatan Simbol'' ===") |
||
| Baris 86: | Baris 86: | ||
[[GIS_AH_C3#Try_yourself..._3|''Kembali ke teks'']] | [[GIS_AH_C3#Try_yourself..._3|''Kembali ke teks'']] | ||
| − | === [[Image:moderate.png|50px]] '' | + | === [[Image:moderate.png|50px]] ''Tingkatan Simbol'' === |
To make the required symbol, you need at least three symbol layers: | To make the required symbol, you need at least three symbol layers: | ||
Revisi per 16 Januari 2015 17.43
Daftar isi
Answer Sheet
"Menambahkan Layer Pertama Anda
 Persiapan
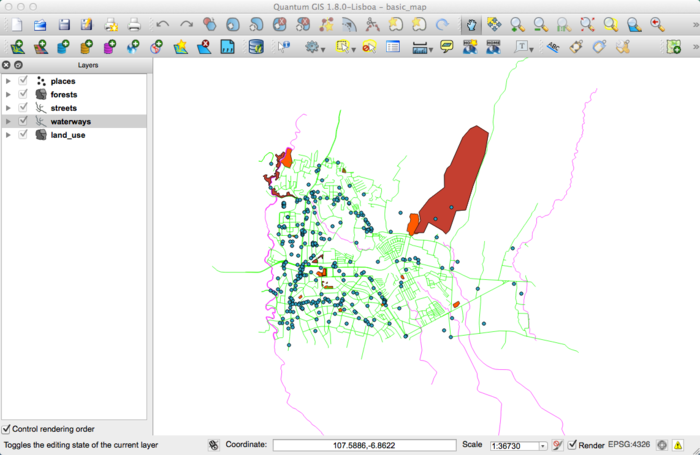
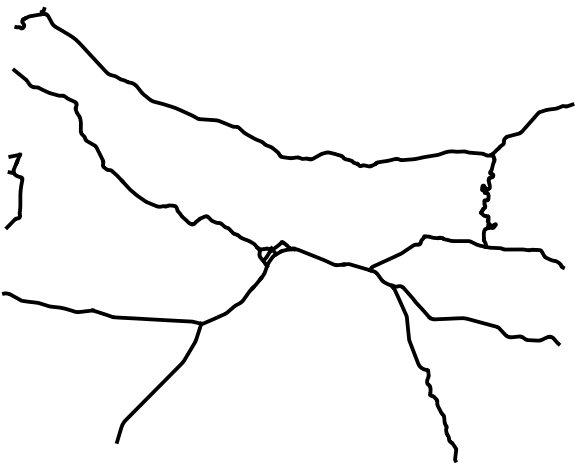
Anda akan melihat banyak garis yang melambangkan jalan. Semua garis tersebut merupakan layer vektor yang baru saja anda muat untuk membuat peta dasar.
Kembali ke teks
Results for Tinjauan Umum Mengenai Antarmuk
 Tinjauan (Bagian 1)
Lihat kembali gambar yang menunjukkan tata letak antarmuka dan pastikan anda mengingat nama dan fungsi dari unsur-unsur tampilan tersebut.
 Tinjauan (Bagian 2)
- Save as
- Zoom to layer
- Help
- Rendering on/off
- Measure line
Kembali ke teks
Results for Bekerja dengan Data Vektor
 Shapefiles
Seharusnya terdapat tiga layer pada peta anda:
- waterways
- places dan
- streets.
Kembali ke teks
 Basis data
Semua layer vektor harus dimuat ke dalam peta. Kemungkinan saat ini peta tersebut belum terlihat bagus:
(Nanti kita akan memperbaiki warna yang buruk ini.)
Kembali ke teks
Results for Simbologi
 Warna
Warna
- Pastikan bahwa warna telah diubah sesuai dengan harapan anda.
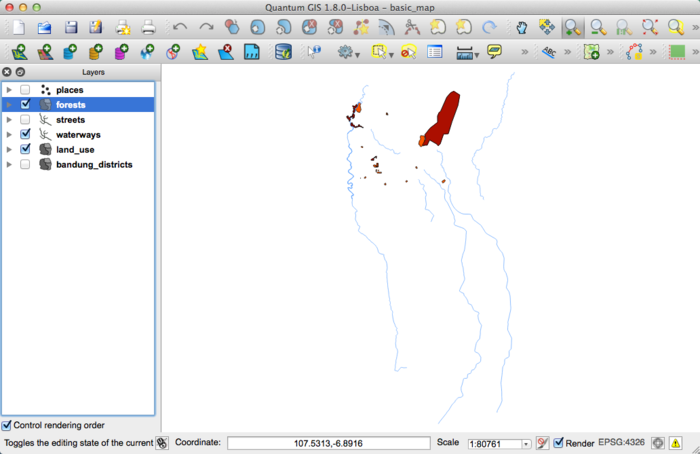
- Untuk saat ini cukup dengan mengubah layer`waterways`. Contohnya dapat dilihat di bawah ini, tetapi mungkin akan terlihat berbeda tergantung dari warna yang anda pilih.
Note: Anda dapat menyembunyikan layer dengan mengklik kotak centang di sebelah nama layer pada Daftar layer apabila anda hanya ingin bekerja pada satu layer dalam satu waktu dan tidak ingin layer lain memecah perhatian anda. Jika kotak centang tersebut kosong, maka layer telah tersembunyi. Kami telah menyembunyikan beberapa layer pada gambar ini.
Kembali ke teks
 Struktur Simbol
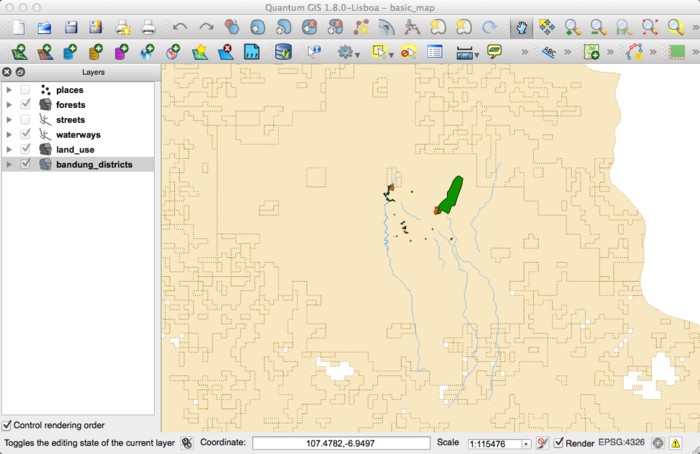
Jika dilihat secara bersamaan, maka layer hutan, perairan, dan bandung_districts seharusnya tampak kurang lebih seperti berikut ini:
Jika anda adalah pengguna tingkat pemula, anda dapat berhenti disini.
- Gunakan metode di atas untuk mengubah warna dan style pada semua layer yang tersisa.
- Coba gunakan warna-warna alami untuk objek. Misalnya, jalan sebaiknya berwarna abu-abu atau hitam tetapi tidak merah atau biru.
- Selain itu, jangan ragu untuk bereksperimen dengan pengaturan :guilabel:`Fill Style` dan :guilabel:`Border Style` yang berbeda untuk poligon.
Kembali ke teks
 Layer Simbol
- Sesuaikan layer dengan keinginan anda, tetapi ingat bahwa masing-masing layer harus dapat dibedakan satu sama lain pada peta.
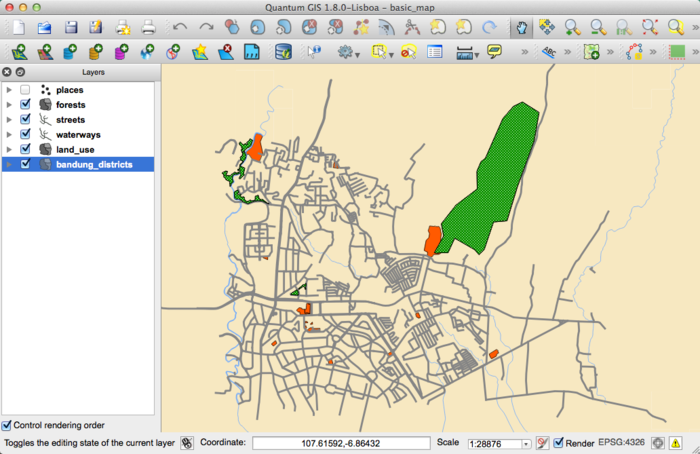
Berikut adalah contohnya:
Kembali ke teks
 Tingkatan Simbol
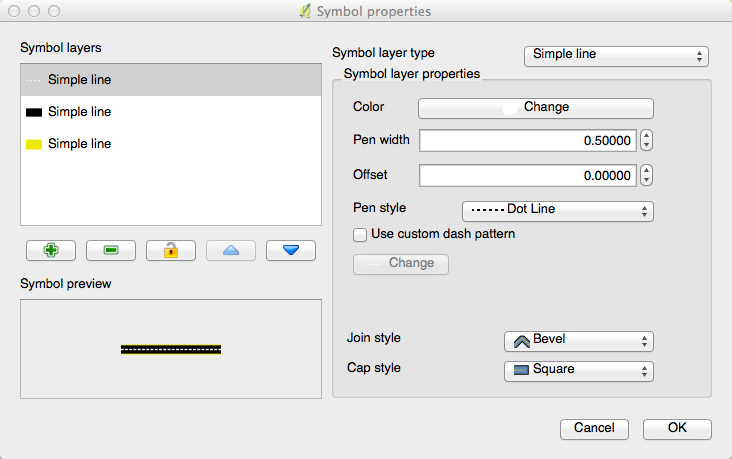
To make the required symbol, you need at least three symbol layers:
The lowest symbol layer is a broad, solid yellow line. On top of it there is a slightly thinner solid dark gray or black line. The symbol layer on top is a thin white dashed line.
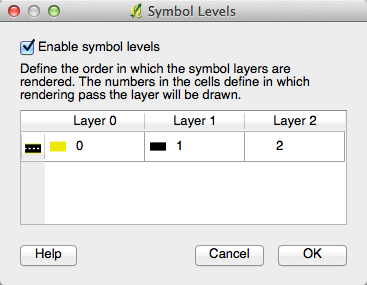
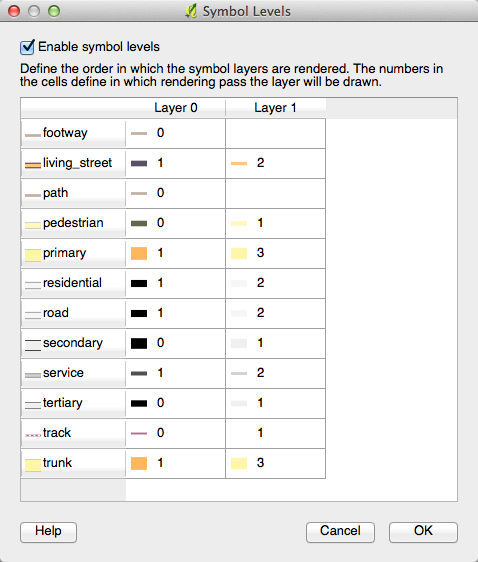
- If your symbol layers resemble the above but you're not getting the result you want, check that your symbol levels look something like this:
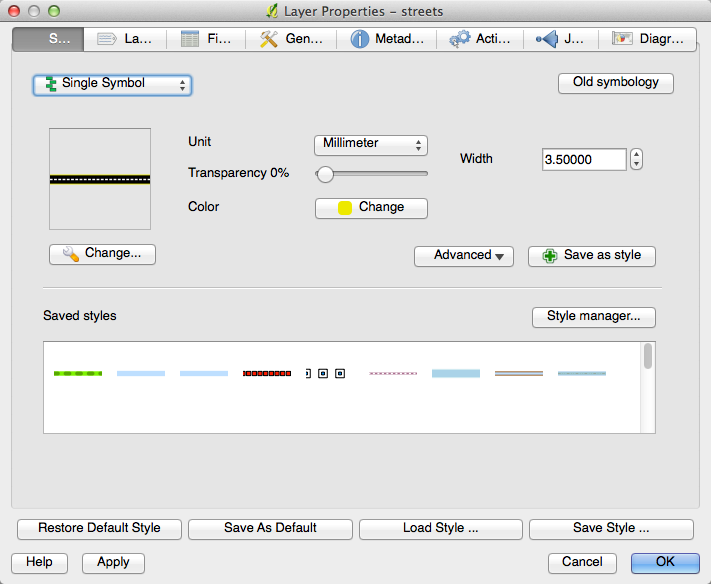
- Now your symbol should look like this:
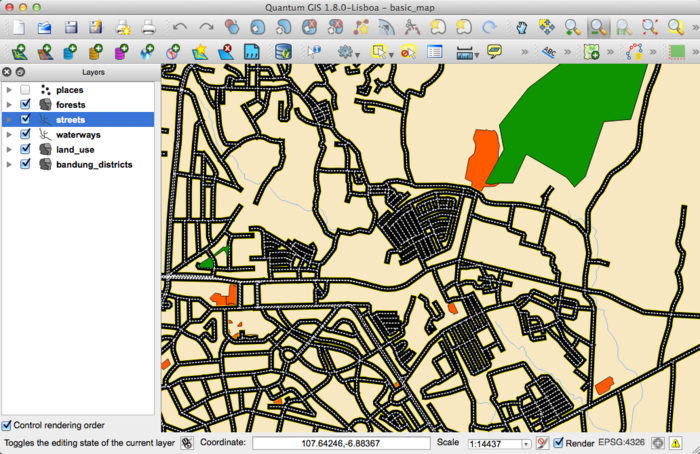
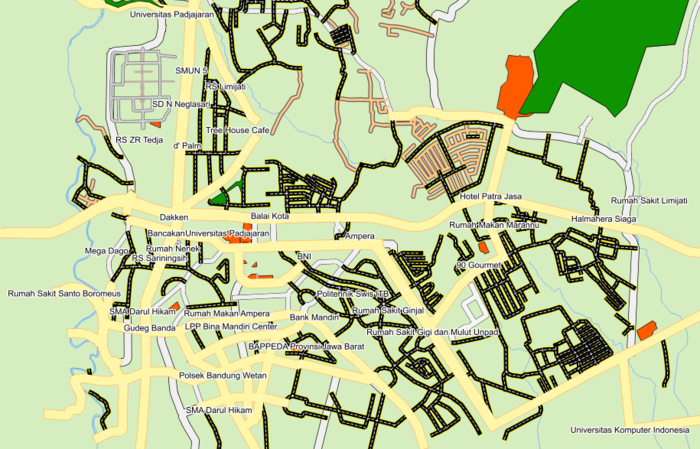
- Which, on the map, gives you this kind of effect:
Back to text
 Symbol Levels
- Adjust your symbol levels to these values:
- There are a lot of symbols with this style
- Experiment with different values to get different results.
- Open your original map again before continuing with the next exercise.
Results for Attribute Data
 Attribute Data
The NAME field is the most useful to show as labels. This is because all its values are unique for every object, and it contains no "null" values (i.e., fields with no value).
Back to text
Results for The Label Tool
 Label Customization (Part 1)
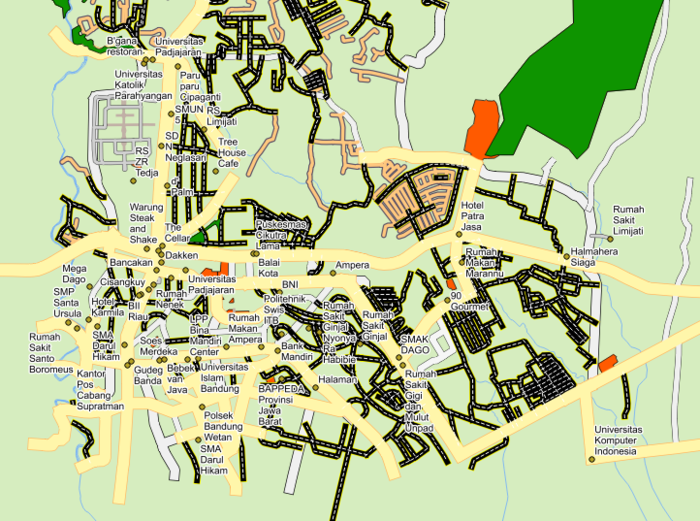
Your map should look like this:
Back to text
 Label Customization (Part 2)
One possible solution has this final product:
To arrive at this result:
- Use the font type
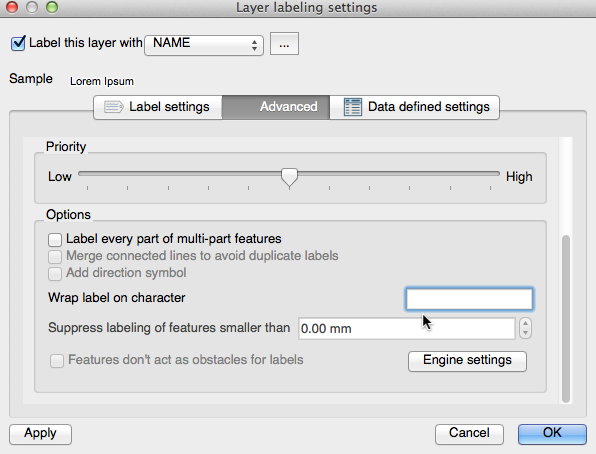
Arialof size10and a Label distance of1,5 mm. - In addition, this example uses the Wrap label on character option:
- Enter a
spacein this field and click Apply to achieve the same effect.
Back to text
 Using Data Defined Settings
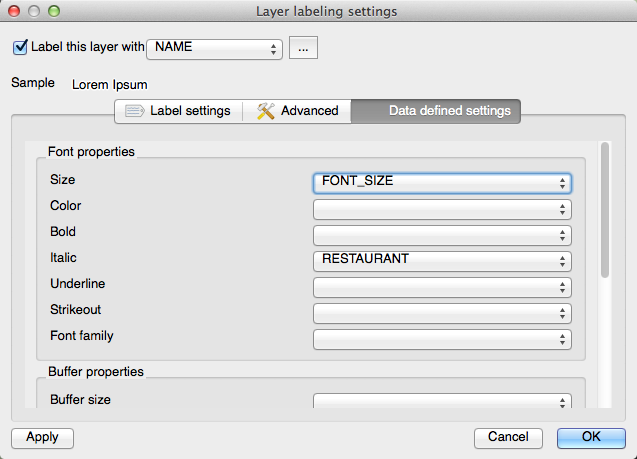
- Still in edit mode, set the
FONT_SIZEvalues to whatever you prefer. The example uses14for universities,12for hospitals, and10for the remaining places. - Remember to save changes and exit edit mode.
- In Data defined settings, do this:
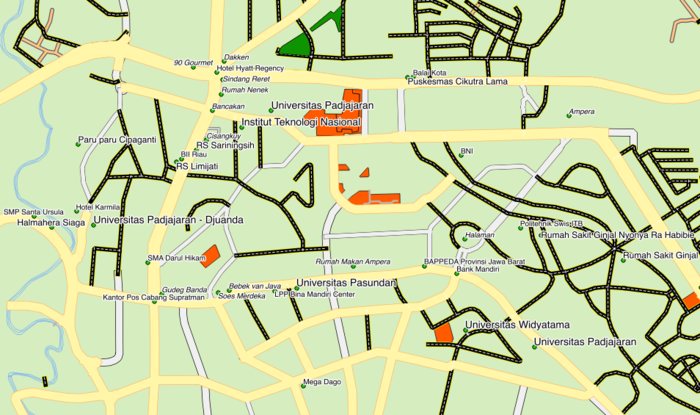
Your results, if using the above values, should be this:
Back to text
Results for Classification
 Refine the Classification
- Use the same method as in the first exercise of the lesson to get rid of the lines:
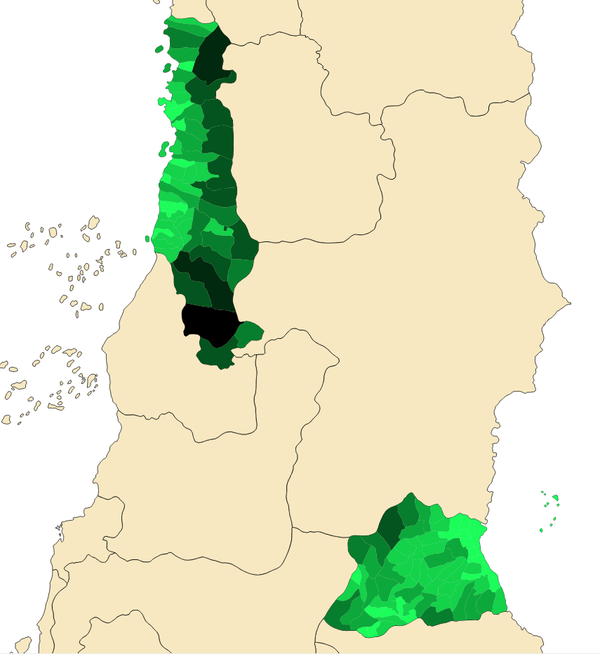
The settings you used might not be the same, but with the values Classes = 7 and Mode = Natural Breaks (Jenks) (and using the same colours, of course), the map will look like this:
Back to text
Results for Vector Analysis
 Find Important Roads
Your layer should now have these roads:
- Save this new layer (the same way you did before) under
exercise_data/residential_development/, asimportant_roads.shp. - Once the new layer has been added to your map, remove the old layer.
- If for some reason it gives you an error message saying that it can't add the layer to the map (this can happen), remember that you can add the layer yourself by using the Add Vector Layer button as you did before.
 Distance from High Schools
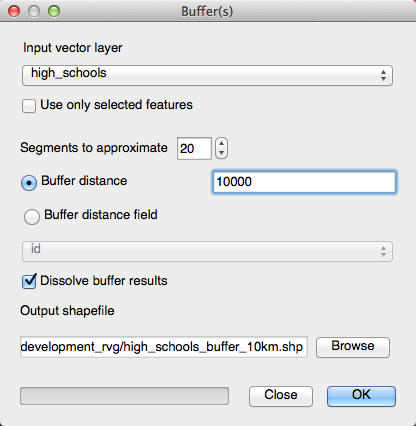
- Your buffer dialogue should look like this:
The Buffer distance is 10000 meters (i.e., 10 kilometers).
- The Segments to approximate value is set to
20. This is optional, but it's recommended, because it makes the output buffers look smoother.
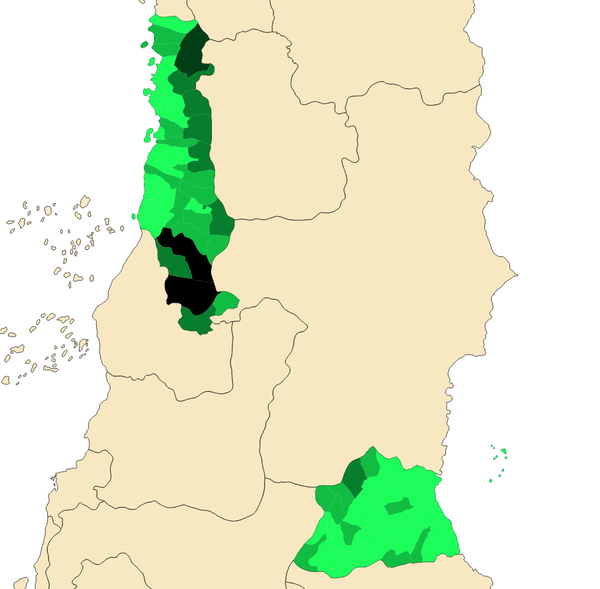
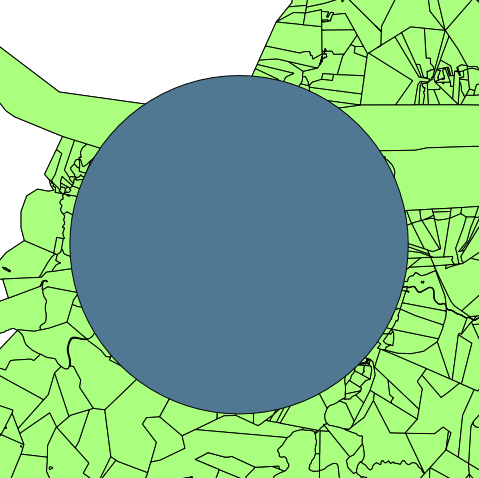
Compare this:
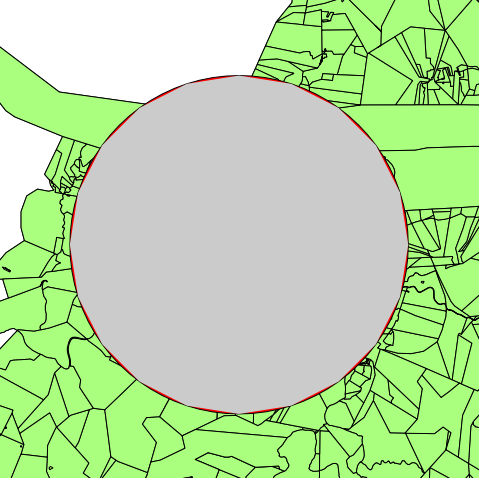
To this:
The red circle is the buffer with Segments to approximate set to 20; the gray circle on top of it is the buffer with Segments to approximate set to 5.
Back to text

