Case Study 1
Daftar isi
Case study 1: Performance measures for veterinary services
Introduction to case study
It is important that a senior veterinarian at the local level is able to assess the performance of local veterinary services. A key function of local veterinary services is to investigate livestock disease syndromes that may indicate outbreaks of important diseases.
One means of reviewing performance of a local veterinary service is to see how rapidly important livestock disease syndromes are investigated. We will use this example for case study 1.
The iSIKHNAS data we will use records the occurrence of a number of priority syndromes such as:
- Abortion and swollen joints
- Biting and behavioural change
- Fever in pigs
- Limping, drooling and vesicles
- Poultry mortality
- Sudden death
These are designed to allow early detection of important diseases such as rabies, vesicular diseases such as Foot-and-Mouth disease, highly pathogenic avian influenza, brucellosis and anthrax.
It is important to note that the data used in this training course was downloaded in early 2014. This data was collected when iSIKHNAS had been operating for approximately a year in a limited area of Indonesia. The incomplete nature of our data means that no real conclusions can be made about the results of data-analyses conducted in this course. However, over time more complete data will be available for Indonesians to conduct better analyses.
Skills to be developed during this case study
- Develop an objective for a data analysis
- Download iSIKHNAS data
- Preserve original data
- Evaluating data (understand the structure of a dataset, identify errors, understand bias)
- Creating new data
- Description of data (measures of central tendency, measures of spread, plotting)
List of files for Case Study 1
Data:
Videos:
Steps in analysis of Case study 1 (exercises)
We will work through the steps of data analysis for this case study.
Step 1: Objective
Before working with the data it is important to have an idea of the question we wish to answer. We call this an objective. Here our general objective is to assess the veterinary services for the speed at which they investigate reports of priority syndromes. We will refine this general objective during an exercise soon (exercise 2).
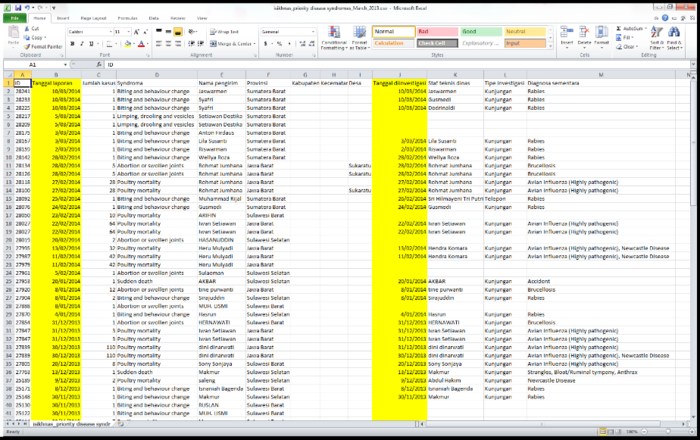
Open the iSIKHNAS data (isikhnas_priority disease syndromes_March_2013.csv) and examine it. Figure 3 is a screen shot of the priority syndromes worksheet and similar to what you should see. Exercise 1 concentrates on understanding the data. Exercise 2 concentrates on developing a more useful objective. Complete exercise 1 and then exercise 2.
Exercise 1: Question (examine the data)
Break into groups of 2-4 people and conduct the following exercises. Place your answers in the box below this one.
Carefully examine the worksheet columns and the data contained within each of the columns.
What does each of the columns mean?
How many priority syndrome reports are there in the worksheet?
Think about the objective of the analyses we wish to conduct.
Which data columns do you think are particularly useful to address our objective? As a hint, two important columns are highlighted in Figure 3.
Report your findings back to the larger group.
Exercise 1: Answer (examine the data)
What do each of the columns mean?
How many priority syndrome reports are there in the worksheet?
Which data columns do you think are particularly useful to address our objective? As a hint, two important columns are highlighted in Figure 2.
Answers are provided in Appendix 2. Please write your own answers before checking the answers in Appendix 2. This will assist your learning.
Now that you have examined the data and understand it, we need to develop a more specific and useful objective for our analyses. This is the purpose of Exercise 2.
Exercise 2: Question (outline a detailed objective)
Determine a more detailed analysis objective. Hint, what would the difference between the two highlighted date columns in Figure 2 show? Use this to develop a specific objective for the analysis.
Report back to the group with your refined objective.
Exercise 2: Answer (a specific objective)
Write what you think a more specific objective of the analyses should be.
Figure 3: The Priority syndromes worksheet of the iSIKHNAS data download.
Step 2: Data management
In this data management section we will:
- Download iSIKHNAS data
- Preserve data
- Evaluate data
- Create new data.
Downloading iSIKHNAS data
This is an important unstructured exercise as it will help you to know how to access iSIKHNAS data for your future work. See the video - Case study 1_data download.avi - for a demonstration of downloading data from iSIKHNAS.
The following steps are how to download iSIKHNAS data.
- Go to the website (www.isikhnas.com)
- Login with your username (cell number or email) and password
- Choose the data set (reports, disease, priority syndrome, then priority disease reports)
- Choose the date range you are interested in
- Choose the geographic area whose data you wish to examine
- Choose run report
- Scroll down and click view download and a csv sheet will download
- Save this and name it appropriately.
Before continuing the course, pause and practice downloading iSIKHNAS data of relevance to you.
We have downloaded the data you will need for the exercises in this course so we can provide you with exercise answers.
Preserving data
Whenever you download a data file you should save two separate versions of the same file.
One copy should be kept unchanged as an original copy of the data file. You will always have an original and unchanged copy of the data file as it was at the time you downloaded it.
The other copy can then be used as the working file for data analysis. During the analysis process you may make a variety of changes to the data including removing or adding data and variables.
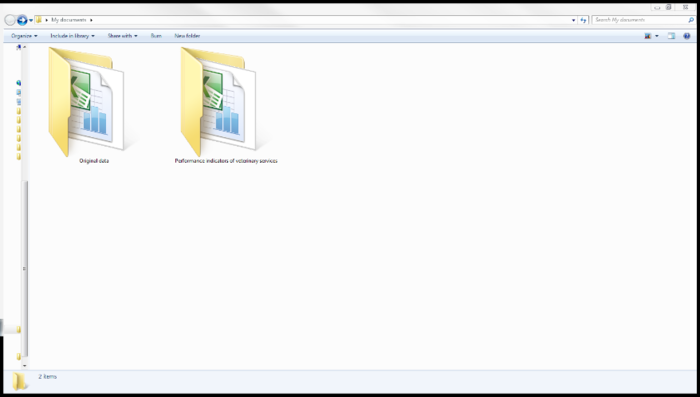
A very good way to do this is to download the original data into a dedicated original data file (for example "Original data" folder in "My Documents"). An alternative practice is to save the original copy with the word _ORIGINAL added to the file name so you can easily identify it. Never work on original data files.
Give each iSIKHNAS download a meaningful name using an appropriate naming convention so you can tell downloads apart. Here we have named our data isikhnas_priority disease syndromes_March_2013.csv.
Having two separate files (working and original) means you can always go back to the original file at any time to start a new analysis or to check what changes have been made in the working copy. If you do go back to the original file to start another analysis, make another working copy of the original file to work on.
See Figure 4 where we have included a screenshot of a possible folder structure with a folder for original data which includes the downloaded Excel file and a separate folder for analysing the data that includes a separate copy of the downloaded data.
Figure 4: Possible folder structure to ensure that original downloaded data is preserved and that analyses occurs in a separate folder with copied data.
Notes: Key concepts about data errors
Evaluating data
Identifying errors and other possible problems in the data
Exercise 3: Question (count missing data entries using Excel)
Count the number of missing data points in the Tanggal diinvestigasi column of the isikhnas_priority disease syndromes_March_2013.csv. Hint: use the filter function in Excel to select only the blank cells (missing data), then count them, or use the countif function in Excel.
Hint: Watch this video for assistance.
Exercise 3: Answer (count missing data entries using Excel)
How many missing values did you count with the filter function?
How many missing values did you count with the "countif" formula?
Exercise 4: Question (selection and information bias).
In your groups, discuss what sort of selection and information bias may be present in the iSIKHNAS data.
Hints: Can you think of any syndromic investigations that may be routinely missing from the dataset? What effect would this have on conclusions based on the data that you do have? This is selection bias.
Can you think of any frequent errors that may occur when you are investigating a syndromic event and making a provisional diagnosis? This is information bias.
Exercise 4: Answer (selection and information bias).
Record some notes from the group discussion on how selection and information bias may occur.
Creating new data It is important to be able to create new columns of data (or variables) using existing columns. This will assist you in doing more detailed analyses of iSIKHNAS data. For example, you will need to do this if you want to determine the time between the report date and the investigation date. In the following exercise you will need to create a new column "jam untuk menyiasat" and populate it with the number hours between reporting and investigation.
Exercise 5: Question (creating new data: hours to investigation)
Create a new column that measure the time between reporting and investigation.
Steps (hint):
Change the format of the columns Tanggal laporan and Tanggal diinvestigasi in the isikhnas_priority disease syndromes_March_2013.csv worksheet to date format (if this is required).
Create a new column heading called time to investigate (masa untuk menyiasat).
Create a formula in the column that subtracts the Tanggal laporan date from the Tanggal diinvestigasi to determine the number of days between dates.
Multiply by 24 to determine the number of hours between reporting and investigation (jam untuk menyiasat).
Convert the answer to a new column of values using paste special (values).
Delete the extra columns, just leaving the jam untuk menyiasat column.
Delete the #NUM! error message using the filter function. These are missing values.
You have now created new data that you can use to investigate the time taken to investigate priority syndromes that allows you to assess the performance of the veterinary services.
Hint: Watch a video for a demonstration
Exercise 5: Answer (creating new data: hours to investigation)
Record in brief note form what you found difficult or easy about exercise 5.
This concludes the step 2: data management. We have considered selection and information bias, we have examined errors and we have created new data. Next, we will describe the data.
Step 3: Description of data
The next stage in analysing this data is to examine the jam untuk menyiasat column and describe it. To do this we will first describe the jam untuk menyiasat column with descriptive statistics and then we will plot the data on a graph. However, before we do this we will provide some notes on descriptive statistics.
Notes: Key concepts for descriptive statistics
Describing a single variable
Exercise 6: Question (calculating measures of central tendency and dispersion of jam untuk menyiasat)
Above we have used 5 simulated values to demonstrate calculations of measures of central tendency and dispersion. Now we will calculate these same measures using real data from iSIKHNAS.
Calculate the mean, median, standard deviation, confidence interval, range and interquartile range for the variable jam untuk menyiasat in the Syndromas prioritas worksheet.
Hint:
Use Excel. Especially use the descriptive analyses tool in Excel.
Hint: See video for a demonstration. This video describes how to conduct the analysis using the Analysis ToolPak in Excel.
If you do not have access to the Analysis ToolPak then you may wish to view the following video on how to calculate the values using individual Excel formulas Watch video now.
Exercise 6: Answer (calculating measures of central tendency and dispersion of jam untuk menyiasat)
Write your answer to each of the parameters in the following table:
Plotting
Now we have finished calculating the measures of central tendency and dispersion on jam untuk menyiasat.
There is an indication that the data is not normal. This is indicated because the mean (750 hours) and median (0 hours) are very different. It is important to look at the distribution of the data in order to be able to choose the most appropriate estimates. For example, will we pay attention to the mean or the median in this case?
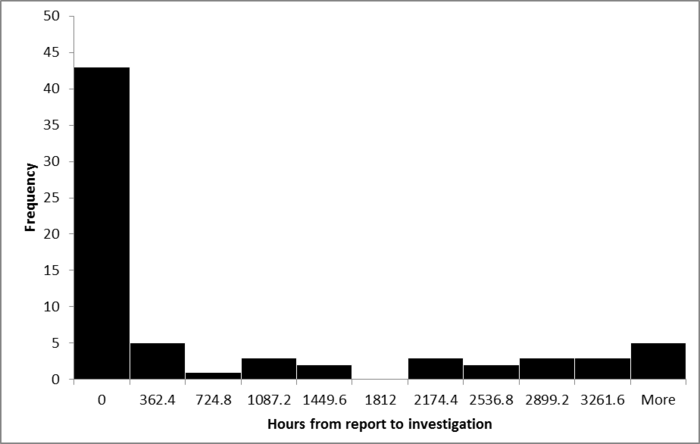
To do this we will create a histogram of jam untuk menyiasat. This will give us an idea of the distribution of the data. We will do this in Excel in a moment as an exercise, but prior to this we will present the histogram and discuss it. Here is the histogram of jam untuk menyiasat (Figure 4).
Figure 5: A histogram of hours to investigate a priority syndrome disease report.
By examining the histogram we can see that the jam untuk menyiasat:
- Ranges from 0 hours to greater than 3261.6 hours.
- There are 43 priority syndromes where investigation was immediate (0 hours). This indicates that a lot of jam untuk menyiasat times were small. This indicates a good veterinary service.
- There is a long tail where the time to investigate is long for some reports of a priority disease.
- The distribution is not normal. The median and the interquartile range are much better descriptive measures than the mean and standard deviation or confidence interval.
Attention is required to see why some times to investigate are very long. These generally occurred in 2013 when iSIKHNAS was new and may indicate an early data recording problem or that investigation procedures have improved since the recording began. However, further efforts to determine the reasons for long investigation times are required.
Exercise 7: Question (histogram of jam untuk menyiasat in Excel)
Create a histogram of jam untuk menyiasat.
Hint: Watch the video for assistance.
Exercise 7: Answer (histogram)
Place the histogram you produced for the hours to investigate in the space below. You may draw it free hand, cut and paste it from the Excel worksheet into this document electronically or print it and physically paste it in to the space.
Step 4: Statistical hypothesis testing
The fourth and final step in data analyses is to conduct hypothesis testing. However, this is not relevant to this case study where we simply wished to examine the time taken to investigate a priority syndrome report. We will conduct hypothesis testing in the next two case studies.
Summary of case study 1
In this case study you first learnt how to download iSIKHNAS data.
You conducted several important steps in data analysis:
- Established an objective.
- Managed data (by backing up your original data, examining the data for errors and creating new data).
- Described data.
These three common steps should always be undertaken no matter what data you have.
It is important to note that sometimes the way you describe data (step 3) will differ. For example here you used measures of central tendency (e.g. a median) and measure of dispersion (Q1:Q3) to describe the data. This sort of description is only useful for a continuous variable. Other types of data will need different approaches to describe them (see Case study 2 where categorical data is described with contingency tables). Regardless of the type of data, you should always try to describe the data by plotting it on a graph.
In this case study it was not necessary to conduct the 4th step (hypothesis testing) as we simply wished to explore the time it took to investigate a priority disease report.
This ends case study 1.


